Making disaster economics compelling for global policymakers
UNDRR's flagship disaster risk report needed to communicate $2.3 trillion in annual losses — without burying the message in data or slowing access for users in disaster-prone regions.
Engagement | Performance | Reach
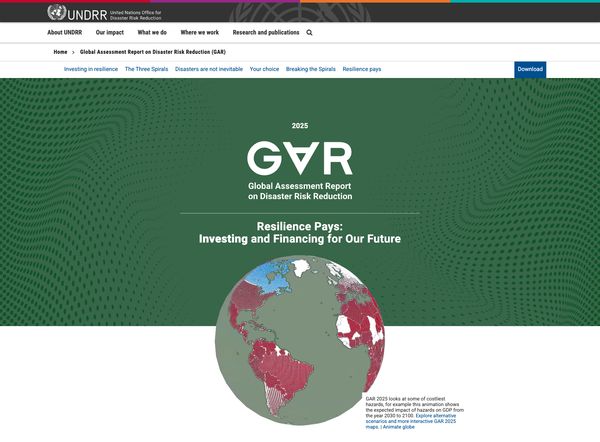
The Global Assessment Report on Disaster Risk Reduction (GAR) is UNDRR's flagship publication — referenced by policymakers making billion-dollar decisions. GAR 2025's central thesis is urgent: disaster costs now exceed $2.3 trillion annually when cascading impacts are included.
But macroeconomic arguments don't move people. Fiscal crises and insurance market breakdowns are abstract. We needed a landing page that made these stakes tangible within seconds — while staying fast on slow connections in disaster-prone regions.
I led content structure, UX decisions, and platform implementation. The work required constant translation between editorial ambitions and technical constraints.
How do you make abstract economics visceral?#
Flagship report launches often default to long pages with heavy media and abstract framing. The key message gets buried. Global access slows to a crawl. We faced a harder challenge: the GAR 2025 thesis involved interconnected economic spirals that couldn't be simplified into a single soundbite.
We started with the number that stops people: $2.3 trillion.
Then immediately connected macro to personal: "But the real cost is far higher." This framing made economic abstractions tangible before diving into complexity.
The Three Spirals became our narrative backbone.
The report identified three interconnected downward spirals — increasing debt with decreasing income, unsustainable risk transfer, and the respond-repeat humanitarian trap. Rather than explain all three upfront, each spiral got its own expandable section with problem framing, real-world examples (Micronesia's 46% GDP impact, US insurance market withdrawal), and concrete "Breaking the Spiral" solutions.
Choice-based futures made policy personal.
We presented two stark 2050 scenarios: "Generation Jolt" (high-regret path) vs "Generation Regeneration" (resilience-invested future). Abstract policy choices became visceral when framed as competing futures.
What happens when editorial ambition meets performance budgets?#
The page brief was ambitious: an animated GDP projection timeline showing hazard impacts across seven climate scenarios (Net Zero 2050 through Current Policies), six embedded interactive maps (fiscal gaps, earthquake projections, drought impacts), and a Datawrapper scatterplot comparing disaster losses — North America's $69.6B (0.23% GDP) vs Micronesia's $4.3B (46.1% GDP).
Any single element could tank Core Web Vitals. Together, they seemed impossible.
We set explicit performance budgets before design began. Every new element required justification against the budget. Some ideas didn't make the cut.
Lazy loading everywhere. All interactive embeds and below-fold images loaded on demand. Intersection Observer API triggered animations only when visible.
Fallbacks for constrained users. Static content for users with JS disabled or slow connections. CDN tuning for efficient global delivery to disaster-prone regions.
Accessibility wasn't an afterthought. All interactive maps remained keyboard-navigable. Alt text and ARIA labels on every visualization. Color-blind safe palettes. Text alternatives for animated content. These weren't nice-to-haves — they were requirements for a page serving users in bandwidth-constrained regions.
What did we actually achieve?#
Engagement: 40% lift during campaign period compared to GAR 2022 launch baseline — measured via time on page, scroll depth, and interactive element engagement.
Performance: Core Web Vitals stayed green despite the heaviest interactive content load we'd attempted. Users in disaster-prone regions with constrained bandwidth could still access the evidence.
Reach: Interactive maps and data visualizations were widely shared on social media, extending report reach beyond traditional policy audiences. Policymakers explored detailed maps. Journalists pulled scannable claims. General audiences engaged with choice-based scenarios.
Why did this actually work?#
The editorial team brought the Three Spirals framework and evidence hierarchy. The design team created data visualizations and interactive components. I translated between these priorities and platform constraints.
The critical moment came early: acknowledging that not every editorial ambition would survive the performance budget. That conversation — had before design began rather than during development — prevented the usual pattern where features get cut at the last minute.
The result: a page that honored the report's complexity while making it accessible, maintained technical performance while enabling rich interactivity, and served multiple audiences without fragmenting the core message.
Links#
- GAR 2025 live page
- Interactive map exploration tool
- Related: Recovering platform performance after a cloud migration failure — the infrastructure work that enabled reliable high-stakes launches
 people found this useful