A fresh coat of paint and making information actionable for 24 years
From early 2000s information design to semantic maps in 2026, the tools changed; my interest in how information connects did not.
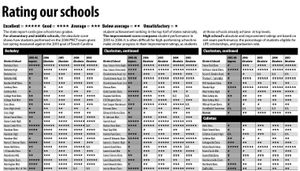
From early 2000s information design to semantic maps in 2026, the tools changed; my interest in how information connects did not.
Datatype is a variable font that turns text into tiny inline charts.
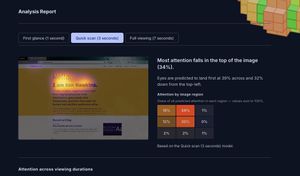
Stop guessing whether users will notice your CTA. Foveacast predicts attention from a screenshot, entirely in your browser, nothing uploaded.
Daniel Vaughan built an agent that generates sketchnotes from YouTube videos — a visual triage step before committing to long-form content.
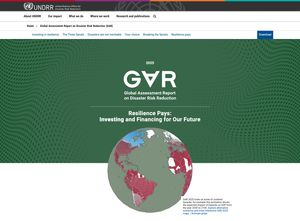
UNDRR's flagship disaster risk report needed to communicate $2.3 trillion in annual losses — without burying the message in data or slowing access for users in disaster-prone regions.
Alphanumeric data works well for programmatic query, but less so for direct human consumption. What if a font was designed specifically with life sciences data in mind?
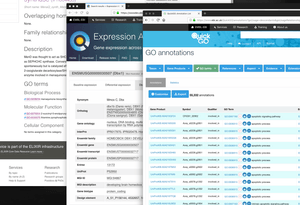
Lyra is, in my view, a proof of concept for developing rich D3-powered information display with a browser GUI.
Printed direct from AllAboutKen.com